.svg)

Understanding Slack Analytics: A Guide
Slack Analytics is a powerful tool that provides insights into your team's communication behaviors. Let's learn more in this post.


Do you find yourself asking, "What does Slack Analytics show?" or "What can be tracked in Slack?" You're not alone. As the digital workspace continues to evolve, understanding the full breadth of Slack's analytical capabilities becomes increasingly crucial. This article will delve into the intricate world of Slack analytics, explaining how you can make the most of this powerful feature to optimize your team's productivity and engagement.
"Slack, a globally recognized communication platform, is designed to improve team collaboration and productivity."
Introduction to Slack Analytics
Slack, a globally recognized communication platform, is designed to improve team collaboration and productivity. Beyond its intuitive chat functionalities, Slack boasts a comprehensive analytical feature—Slack Analytics. This tool provides an array of insightful metrics to help team administrators understand how their workspace is being utilized. It's not just about messages sent or channels used; Slack Analytics can reveal user trends, engagement statistics, and much more.
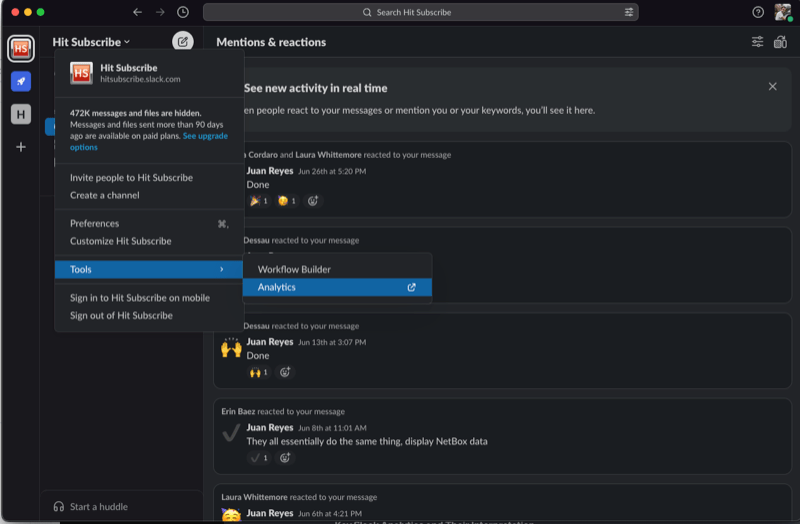
Accessing the Slack Analytics dashboard is a simple process. Follow the steps below:
- Open Slack: Start by opening the Slack application on your desktop or accessing it through your web browser.
- Select Workspace: Navigate to the workspace you want to analyze. If you're a part of multiple workspaces, make sure you've selected the correct one.
- Open Workspace Menu: On the top left corner of the Slack interface, you'll see your workspace's name. Click on it to open a dropdown menu.
- Open Settings & administration: In the dropdown menu, find and click on Settings & administration. This option will open up further to show you additional options.
- Select Workspace analytics: In the Settings & administration options, click on Workspace analytics.
And voilà! You're now in the Slack Analytics dashboard for your workspace. Here, you can peruse different metrics and data under the Overview, Channels, and Members sections to get a comprehensive understanding of your workspace's Slack usage.
Remember, only workspace owners and admins have access to the Slack Analytics dashboard. If you don't see the Settings & administration option, it's likely because you don't have the necessary permissions. In this case, you'll need to request access from your workspace owner or admin.
The Slack Analytics Dashboard
When you open Slack Analytics, you're greeted by the dashboard—a single view that contains all your workspace's data. The Slack Analytics dashboard is your control center for all things analytics. It provides a cohesive yet detailed view of your workspace's activity.
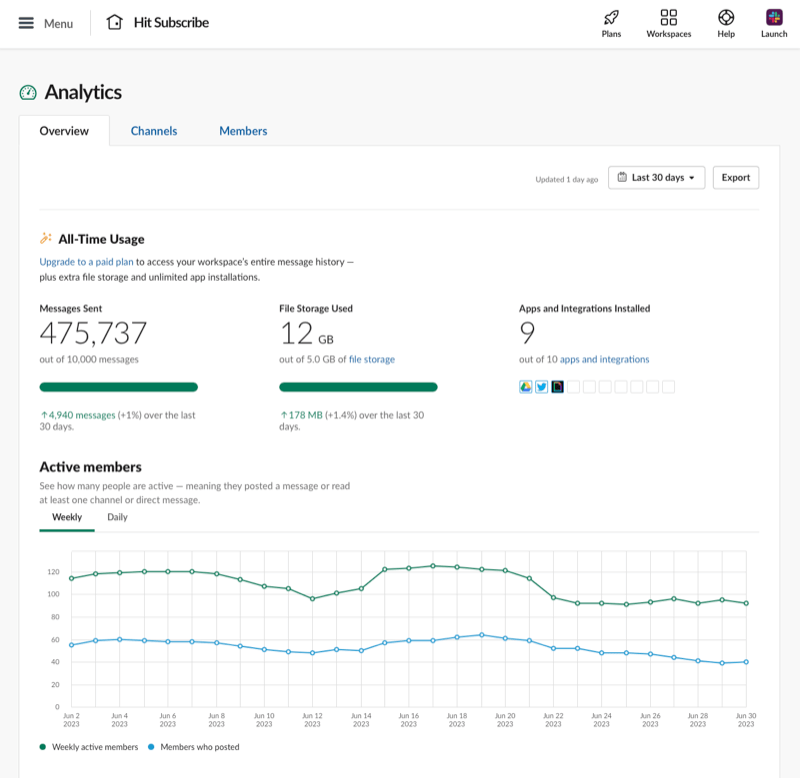
The dashboard is broken down into three main sections: Overview, Channels, and Members.
Overview
The Overview section provides a snapshot of your workspace's activity. It displays several crucial metrics, each with its unique insights:
- Total Messages: This metric includes all messages sent in public channels, private channels, and direct messages. It helps you gauge the overall communication volume in your workspace.
- Public and Private Channels: Here, you can see the total number of public and private channels created in your workspace. Public channels are visible to all members, while private channels are exclusive to invited members.
- Files Shared: This count includes all files shared across channels and direct messages. Files can be anything from documents, images, and audio files to videos.
- Active Members: This metric shows you the number of members who have been active in your workspace, providing an idea about the overall usage.
Channels
The Channels section delves into the specifics of each channel. Here, you can track and measure how each channel contributes to your workspace's communication:
- Total Messages: This stat shows the total number of messages sent within each channel. High activity in specific channels can highlight hot topics or especially active teams.
- Members: This metric indicates the total number of members in a channel. It can help identify the scope of communication within that channel.
- Reactions: This count shows the total number of reactions in each channel, which can provide insights into engagement levels within the channel.
Members
The Members section offers in-depth insights into individual user activity. You can understand how each team member contributes to your workspace's communication:
- Total Messages: This stat displays the total number of messages each member has sent across all channels and direct messages.
- Reactions Given: This metric shows a member's total number of reactions. It's a helpful gauge of how engaged a member is in conversations.
- Days Active: This count indicates the number of days a member has been active in your workspace over the selected period.
- Mentions: This stat displays the number of times each member has been mentioned in channels or direct messages, providing insights into their involvement in discussions.
In a nutshell, the Slack Analytics dashboard is an expansive yet intuitive interface that provides valuable data-driven insights. By navigating through the Overview, Channels, and Members sections, you can identify trends, understand communication habits, and make informed decisions to enhance your team's productivity and engagement.
Key Slack Analytics and Their Interpretation
Now that we've explored the Slack Analytics dashboard, let's delve into some of the key analytics and learn how to interpret them.
Usage Statistics
Usage statistics provide a wealth of data about how your team uses Slack. Some key stats include:
- Messages Sent: This metric indicates the total number of messages sent in a workspace. High message volumes suggest an effective collaboration but could also mean potential information overload.
- Channels Used: This stat reveals the number of active channels in your workspace. If there are too few, team communication might be crowded and confusing. Too many indicate a fragmented team.
Engagement Statistics
Engagement stats give insights into the level of interaction amongst your team members. These include:
- Active Users: This metric shows the number of users actively engaging on Slack. If this number is low, it could imply that your team isn't utilizing Slack to its fullest potential.
- Reaction Count: Reactions are a way for team members to respond to messages quickly. A high reaction count may indicate that your team engages in conversations.
- Searches Performed: This metric shows how often the search feature is used. Frequent searches mean finding information is challenging, suggesting a need to improve channel organization or message archiving practices.
User Trends
User trends help you understand how your team's Slack usage evolves over time. Key metrics include:
- User Growth: This metric displays the change in active users over a selected period. A steady growth rate suggests that your team consistently adopts Slack for communication.
- Retention Rate: The retention rate shows the percentage of users who continue using Slack after their first month. A high retention rate suggests members find the platform valuable for daily communication.
"Slack Analytics is a powerful tool that provides insights into your team's communication behaviors."
Making the Most of Slack Analytics
Slack Analytics is a powerful tool that provides insights into your team's communication behaviors. By understanding and analyzing these metrics, you can better tailor your workspace to suit your team's needs, streamline workflows, and, ultimately, foster a more productive, engaged team.
Remember, while numbers and trends are significant, the human element behind the data is equally crucial. Use these insights to change the system and have conversations with your team, gather feedback, and implement improvements that align with everyone's needs.
In the era of remote working and digital collaboration, maximizing your team's usage of tools like Slack is no longer an option; it's a necessity. So, fully utilize Slack Analytics and unlock your team's potential. By doing so, you'll be well on your way to creating a collaborative, efficient, and engaged digital workspace.
By understanding Slack Analytics, you can confidently answer your burning questions of "What does Slack Analytics show?" and "What can be tracked in Slack?" and use these insights to drive performance and productivity. Your data-driven journey starts here.
Start automating your ticketing and workflows with Wrangle
Another tool you can add to your stack to maximize efficiency is Wrangle, a slack ticketing and workflow application. Unlike traditional ticketing systems, Wrangle enables your team to manage complex processes and requests in Slack. Imagine managing approvals and ticketing requests directly in your Slack channel.
Teams are using Wrangle to manage:
- IT Help Desks
- IT Access Requests
- Procurement Processes
- Marketing Collateral Approvals
- Employee Onboarding and Offboarding
- Customer Onboarding
- Contract Approvals
If it’s a process that needs automation in Slack, Wrangle has you covered. You can start creating tickets and workflows with Wrangle’s no-code platform in minutes. You build your flows in the easy-to-use web interface, but your end user makes requests in your Slack workspace minimizing context switching.
To get started, try the app today and see firsthand how Wrangle can improve productivity within your company. We can also provide you with a personalized demo, which you book on our website.
Conclusion
From usage statistics to engagement data and user trends, Slack Analytics provides a treasure trove of valuable insights. Learning to navigate and interpret these metrics allows you to take a data-driven approach to improve communication, increase engagement, and foster a more efficient and collaborative workspace. As they say, knowledge is power—so harness the power of Slack Analytics and drive your team toward unparalleled success.
This post was written by Juan Reyes. As an entrepreneur, skilled engineer, and mental health champion, Juan pursues sustainable self-growth, embodying leadership, wit, and passion. With over 15 years of experience in the tech industry, Juan has had the opportunity to work with some of the most prominent players in mobile development, web development, and e-commerce in Japan and the US.
Wrangle learns from your tickets and knowledge base to handleup to 75% of Slack questions automatically.

4.7 Average rating


Turn Slack into a productivity powerhouse with Wrangle
Create a scalable helpdesk in Slack. Automatically turn messages into trackable tickets and provide faster, more transparent service to your colleagues and customers with Wrangle — Try it free!
Wrangle learns from your tickets and knowledge base to handleup to 75% of Slack questions automatically.
4.7 Average rating